11mar20: analyzing the surface errors.
11mar20
last update: 29apr30
Links
Other p50 pages
p50 main page
20200311: p50
scanning from ao9 main page
Topics:
The optics of the telescope expects a sphere of radius 265.176
meters (870 feet). After the 2002 dish adjustments, the best
fit sphere had a radius of 265.140 meters (869.883 feet).
The data from scan19 (more info). was used to investigate
the current radial errors on the dish. The fits from scan19 showed
that the x and y offsets ( east,north) of the center of the sphere
did not vary much as we tried different radii. For this analysis
we'll use the x,y offsets of the center that were found for the 3
parameter fit (fit for center, radius fixed at 265.176 meters). Not
that the x,y,z offsets include the offset of the scanner from AO9
(the monument).
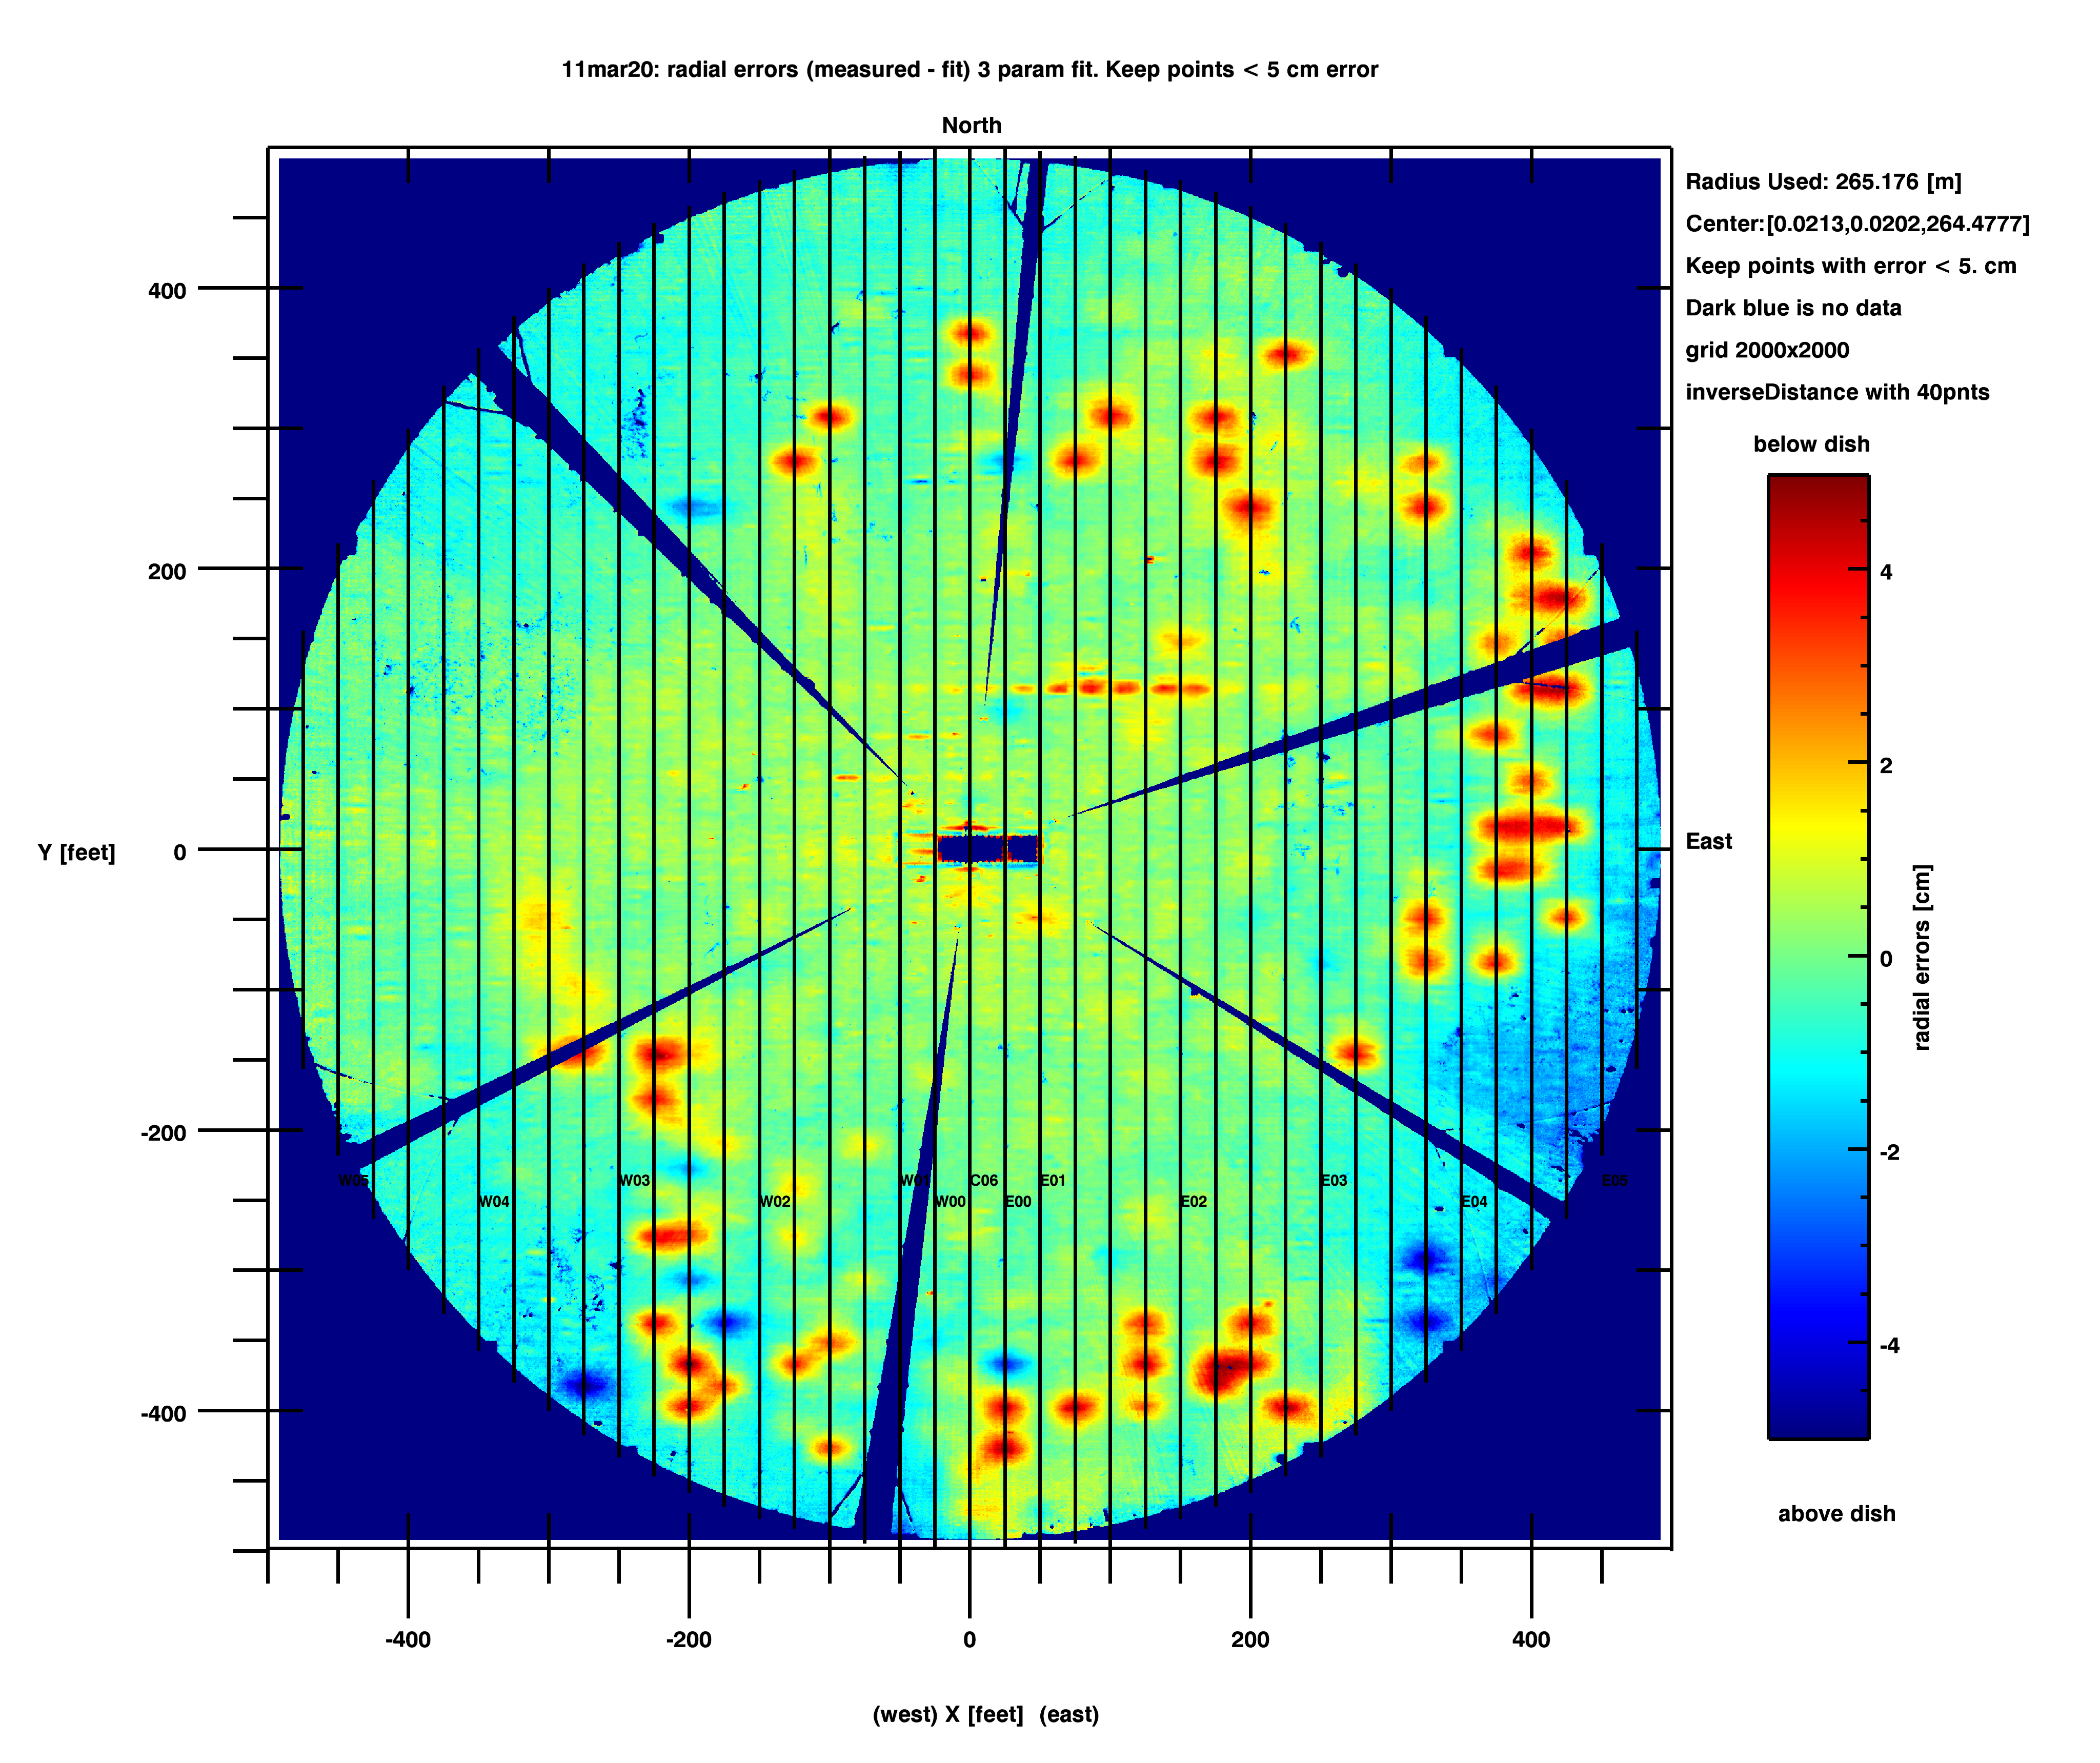
As a reference, the image shows the
radial errors using a fixed radius of 265.176 meters (.png)
- the radial errors are in cm. the x,y axis is in feet :).
- Red means the dish is below the design surface (radius too
long)
- blue has the dish above the design surface (radius too short)
Gain loss as we vary the radius of
curvature.
The table below records some of the radius of
curvature seen on the primary
radius
of Curvature
|
delta
ref-val
[cm]
|
Notes
|
feet
|
meters
|
|
|
870
|
265.176
|
0.
|
Reference design for optics
|
869.883
|
265.140
|
-3cm
|
2002 best fit sphere after alignment
|
869.773
|
265.107
|
-7cm
|
2020 best fit sphere using 4 parameter fit
(center and radius)
|
After the 2002 alignment the best fit radius was
3cm shorter than the design value. When using the 4 parameter fit in
mar20, the best radius was 7 cm shorter than the design value.
The plots shows how
the radial error and gain loss varies as you change the radius of
curvature (.ps) (.pdf)
- These plots assume the correct radius of curvature is 265.176
meters. It then looks at the radial error if you use a sphere of
smaller curvature.
- the smaller sphere has its center of curvature moved down by
the same amount as the radial shortening (so the curves all
overlap at the center of the dish)
- Page 1: assume the radius of curvature is 3cm short (2002)
- top frame: the radial error vs xy distance from the
center of the dish.
- Near the center, changing the radius does not affect the
radial errors (since you also moved the center).
- Toward the edge of the dish (150m) the radial error if
-.55 cm (it's too short)
- The red and blue lines show where a 225m beam is
placed for the gain loss computation
- Bottom frame: The gain loss vs frequency for a radius
3cm short.
- The complex electric field was integrated over a 225m
circular beam.
- The phase was radialErr/Wavelength*2*pi.
- The red line is a beam centered at za=0 degrees (center of
the dish)
- the blue lines is a beam centered at 8.7deg za (40meter
offset). This beam just touches the edge of the 305meter
diamter.
- At 5 Ghz the loss is -.02 and -.1db for the 2 curves
- at 10 Ghz (3cm) the loss is -.13db and -.34 db
- so the 2002 sphere did not add appreciable loss
- Page 2: assume the radius of curvature is 7 cm short (2020
4 parameter fit).
- The two frames are similar to page 1
- At the edge of the dish, the radial error is -1.3cm.
- The gainloss is
- 6cm: -.2db and -.5db
- 3cm: -.7db and -1.9db
The 7cm radial error gets up to
-2db at 10ghz. The measured gain loss at xband can be up to 8db,
so this is only part of our problem
processing: x101/p50/200311/analyzerrs/lossradiusshort.pro
Current radial errors and radius
of curvature
This section looks at how the distribution of errors across the
dish depend on the radius of curvature.
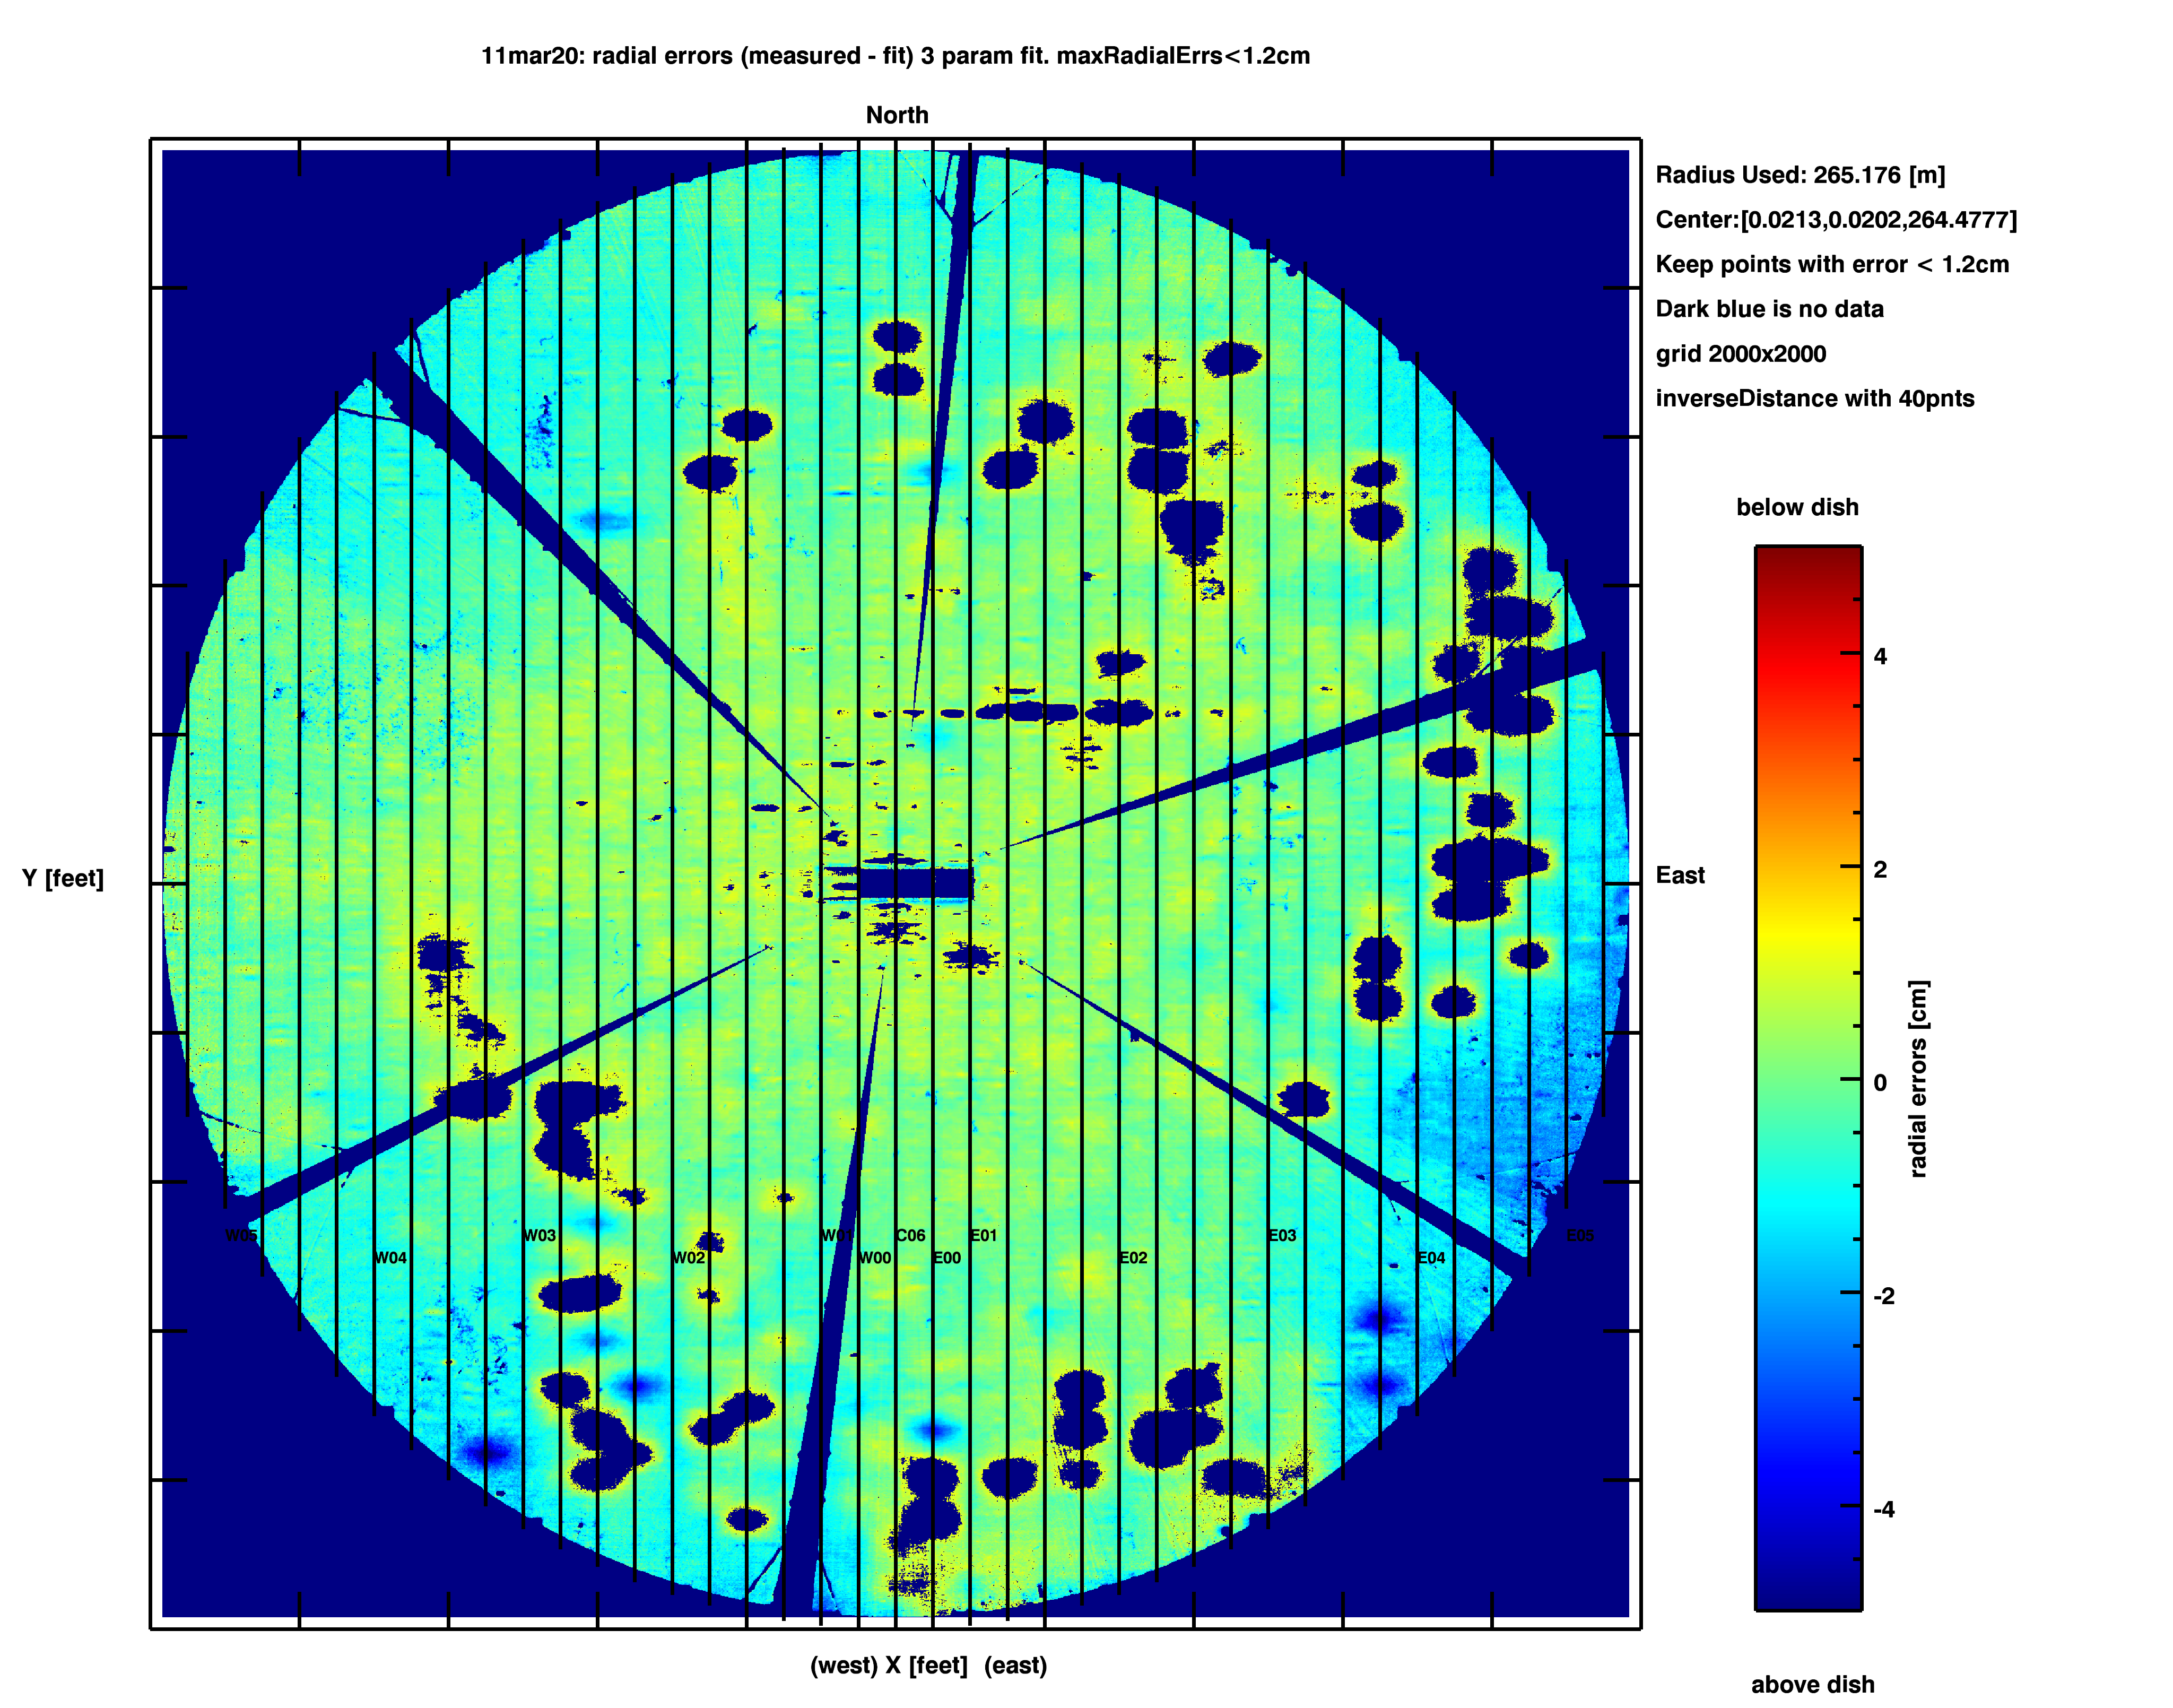
The image shows the radial
errors (Measured - fit) for the 3 parameter fit (.png)
- The colors show the radial errors.
- Red has a radius 5cm too long (below the reference surface)
- blue has a radius 5cm too short (above the reference
surface)
- You'll notice a blue area around the edge of the dish. Which
means it is above the reference surface.
- Part of this can be explained by having a radius of
curvature that is too short.
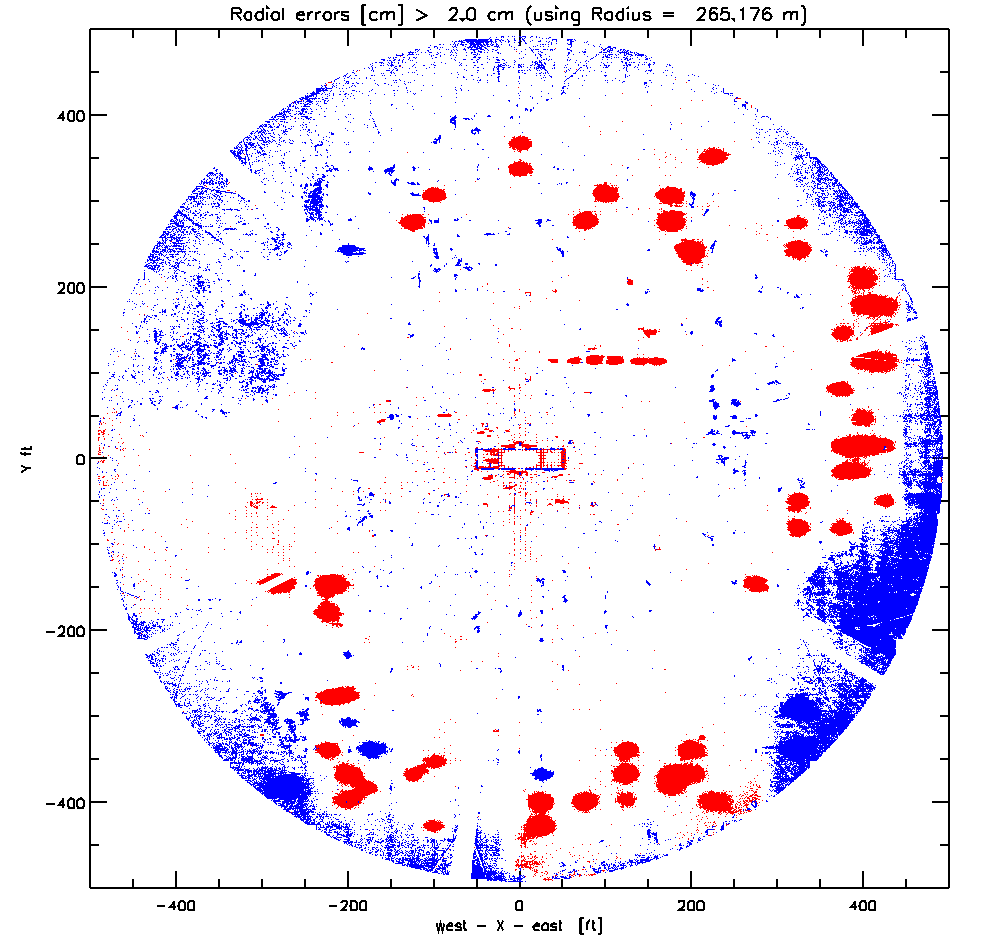
The table below shows how the errors change as we
vary the radius. The plots were made by:
- Start with the radius, center of the reference image
(265.176 meters)
- Recompute the errors using a shorter radius
- make the radius shorter, and lower the z0 center of the
sphere by the same amount
- Clip to show only the errors above 2 cm (red points) and below
2cm (blue points)
Offset from 265.176
[cm]
|
Radius
[m]
|
img
|
Notes
|
0
|
265.176
|
.png
|
Design radius
|
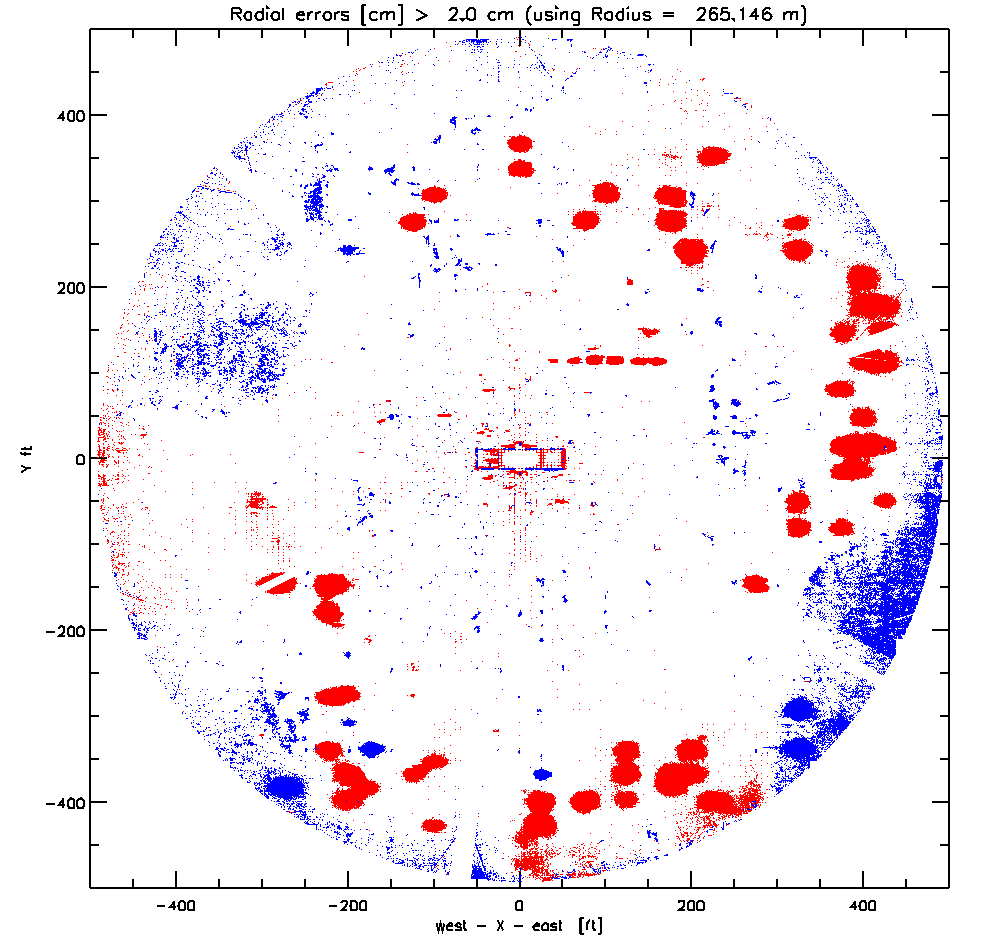
-3
|
265.146
|
.png
|
Radius after 2002 adjustments
|
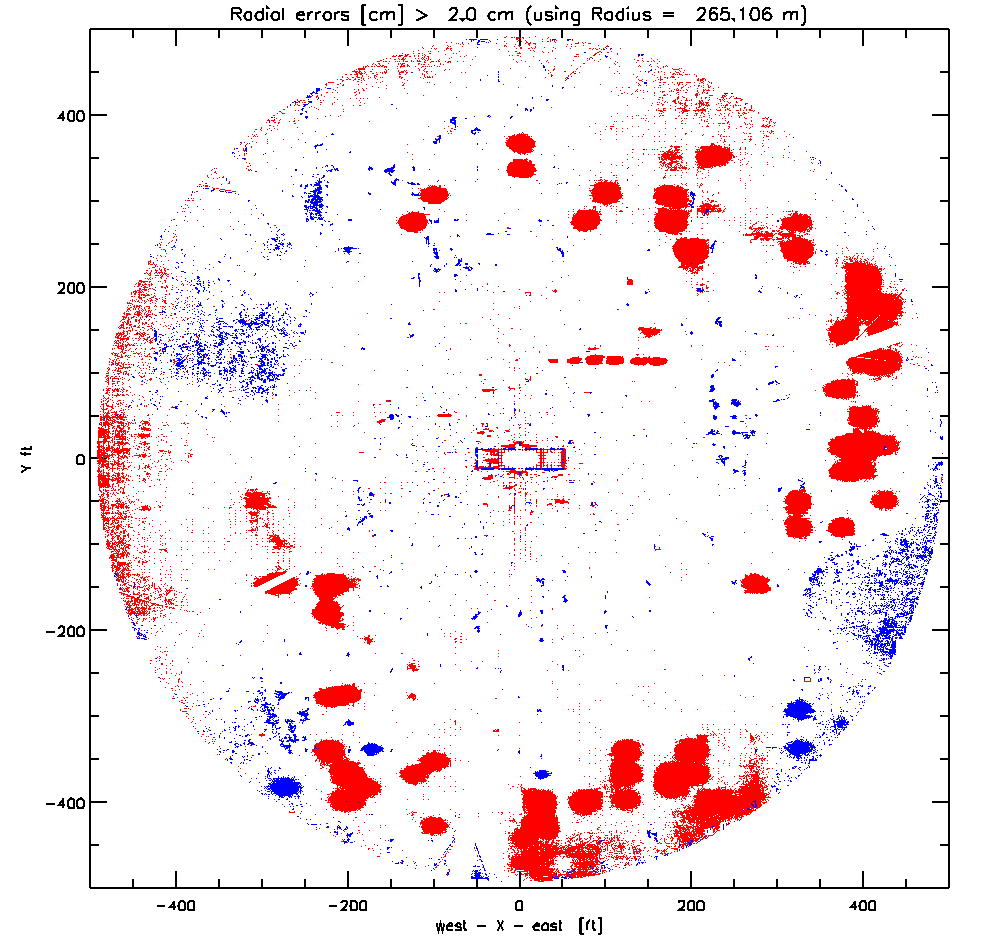
-7
|
265.106
|
.png
|
best fit radius from 4 parameter fit.
|
- The red ovals are problems with main cable tiedowns pulling
too much on the portion of the dish above them.
- As the offset moves from 0 to -7 cm, the blue outer rim
decreases.
- Changing the radius does not affect the central portion of the
dish as much (at least not outside of 2cm error).
- The 4 parameter fit (center and radius) ended up with a radius
7 cm short
- It pushed the center of curvature down until the errors at
the center started to cancel,
processing: x101/p50/20311/analyzerrs/errsabovecliplev.pro
The gain loss was computed using the measured
radial errors. The processing was:
- Use the 2000x2000 grid of radial surface errors. Any errors
> 5 cm were ignored (to remove things like hf dipoles)
- generate are 2k x 2k reference grid of random errors with an
rms of .22 cm. This was the goal for the 2000 survey results.
- Pick an x,y spot on the dish
- find all points with measured rms errors within 225/2.
meters of this point (beam radius)
- generate the phase errors for a particular wavelength for
these points: radialErrcm/lambdaCm * 2*pi.
- generate the complex E field for all of these points using
unity amplitude and the measured phase.
- Sum the E field for the reference and sum the Efield for the
measured points.
- Take the ratio of the intensities as the gain loss.
The plots show the gain loss results for
beams centered on a 5x5 grid with 200 foot spacing (.ps)
(.pdf)
- Each frame shows beams moving from -400 to +400 x
position. (- is west)
- The top frame is y = +400 (north), the bottom frame is -400 ft
(south)
- The gain loss was computed for 21, 12.3,6, and 3 cmd
(1420,2380,5000, 10000 Mhz)
- the colors show the different wavelengths
- The large errors at +x and -Y are mapping into gain
losses (especially at 10 ghz)
- The losses at x and cband are similar to what we see on the
telescope calibration runs.
- The sband losses are smaller than the ones we've measured on
the telescope.
- What these plots don't measure:
- I only took points on the dish.. for the measured and
reference beams. When the beam spilled over, i ignored those
points (since there were no measured errors). The plots do not
show the normal gain falloff because of the spillover.
- There may be points > 5cm that were excluded (by my
thresholding)
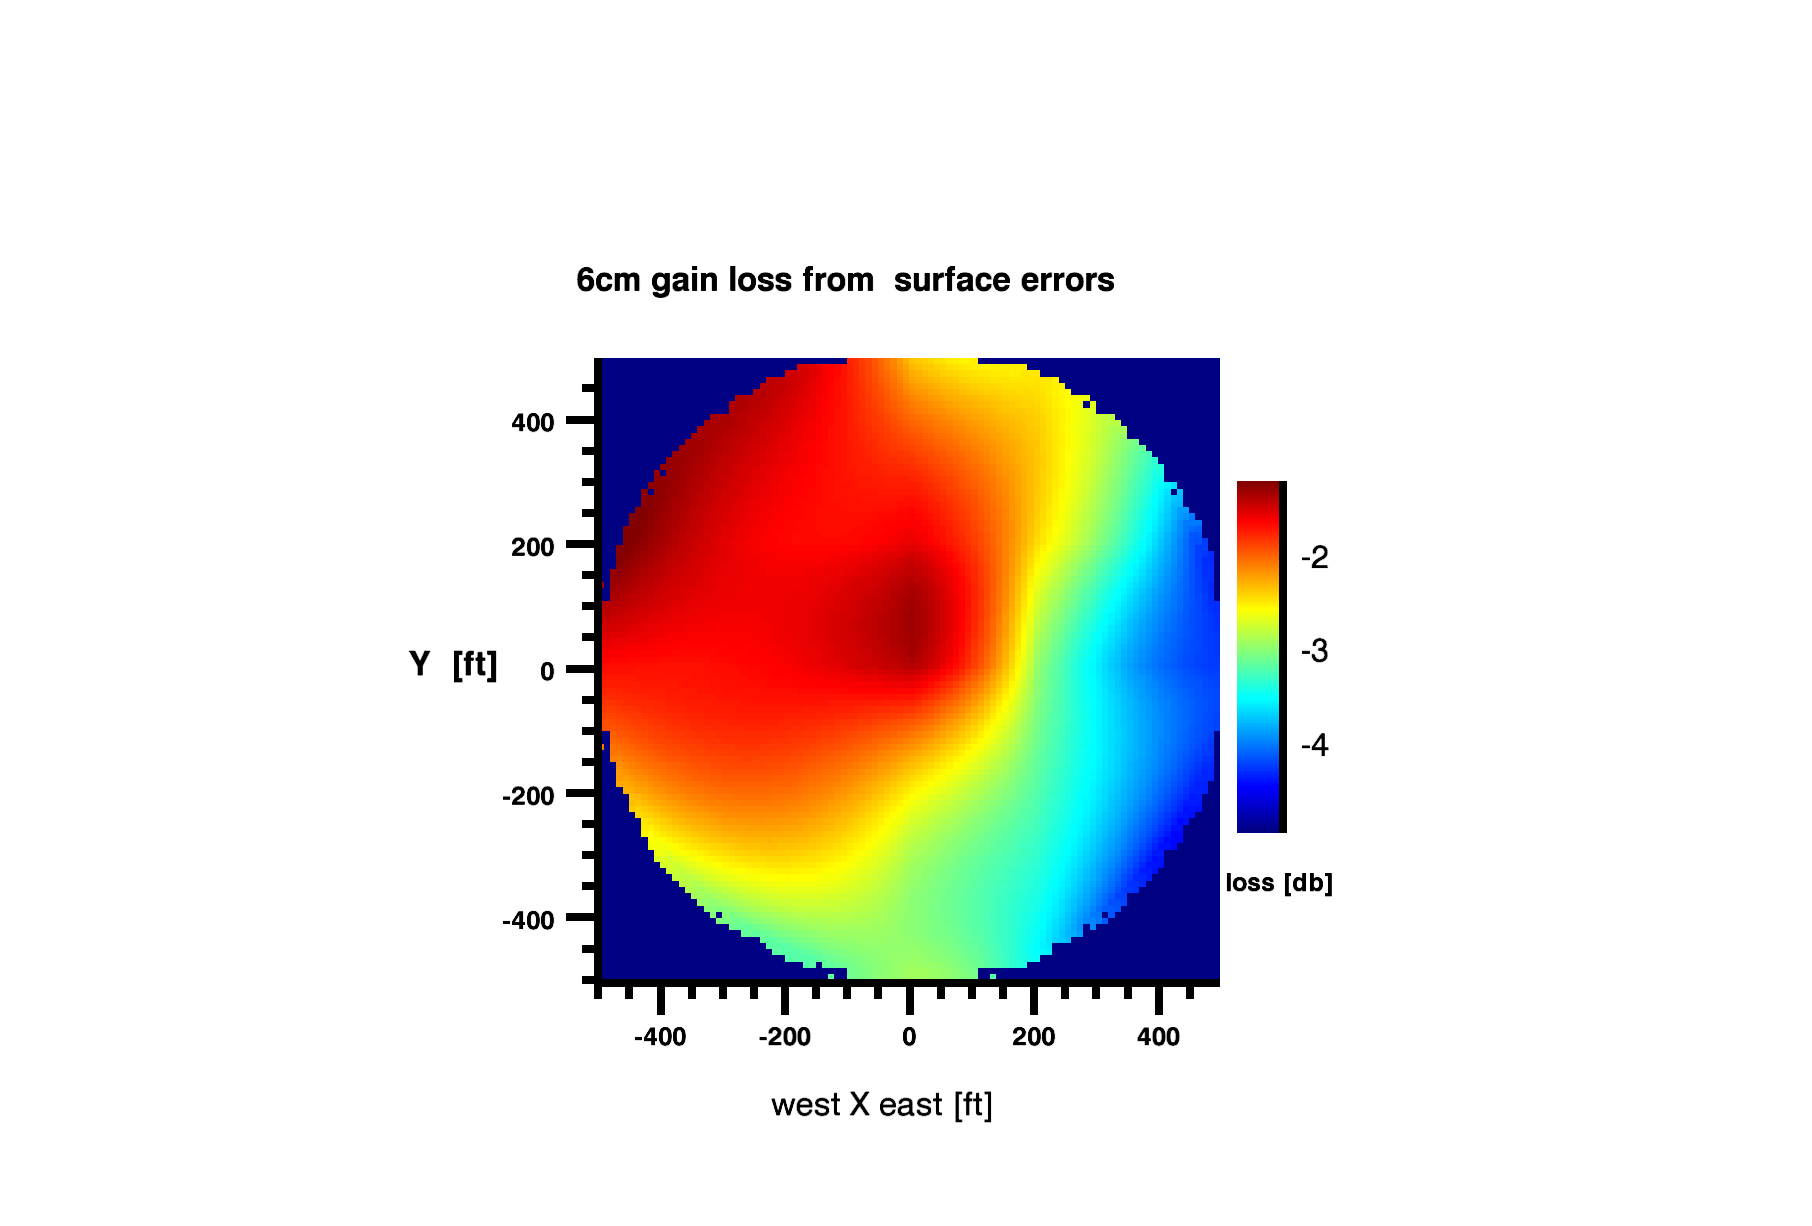
The image
gives a rough idea of what the gain loss should be at 6cm across
the dish (.png)
- the image was made by creating a grid via interpolation
of the points in the line plot above.
These errors only use the radial errors on the dish. Errors from
collimation/positioning of the secondary and tertiary would add to
these errors.
processing: x101/p50/200311/gainloss.pro
Gain improvement by fixing the
large errors.
The large errors centered on the
main cables are caused by tiedown blocks that have moved downhill,
pulling too hard on the main cables.
The other large error is from the east-west cable that was broken
and then repaired.
An attempt was made to compute the gain
improvement we would get if we just fixed the large errors.
The steps were:
- Start with the 2000x2000 gridded image of radial errors
(clipped to +/- 5cm)
- compute the gain loss for these errors using the same steps as
"gain loss from surface errors" above.
- make a copy of the 2000x2000 image and set all points with
|errors| > 1.2 cm to no data.
- this would get rid of most of the large errors.
- recompute the gain loss for this dataset.
The image shows the
radial errors after clipping all points > 1.2 to nodata
(.png)
- The dark blue areas were > 1.2 cm error and have been
excluded.
The plots
<- page up
home_~phil